
Hudson Valley by the Numbers
We love digging into the numbers and trends, so we can take a close look at what’s happening in our communities and why. This information helps our communities to make informed decisions about important issues including infrastructure, housing, education, workforce, and community issues.

April 2021

Largest Increase in Median Household Income Since 2010
April 20th, 2021 Since 2010, these five towns experienced the largest increase in median household income in the Hudson Valley region. Median household incomes from 2010 were adjusted for inflation before calculating the [...]

Geographic Mobility over One Year – Hudson Valley
April 13th, 2021 According to 2019 American Community Survey data, Greene County had the least amount of geographic mobility in our region with 93.9% of current residents over the age 15 living in [...]
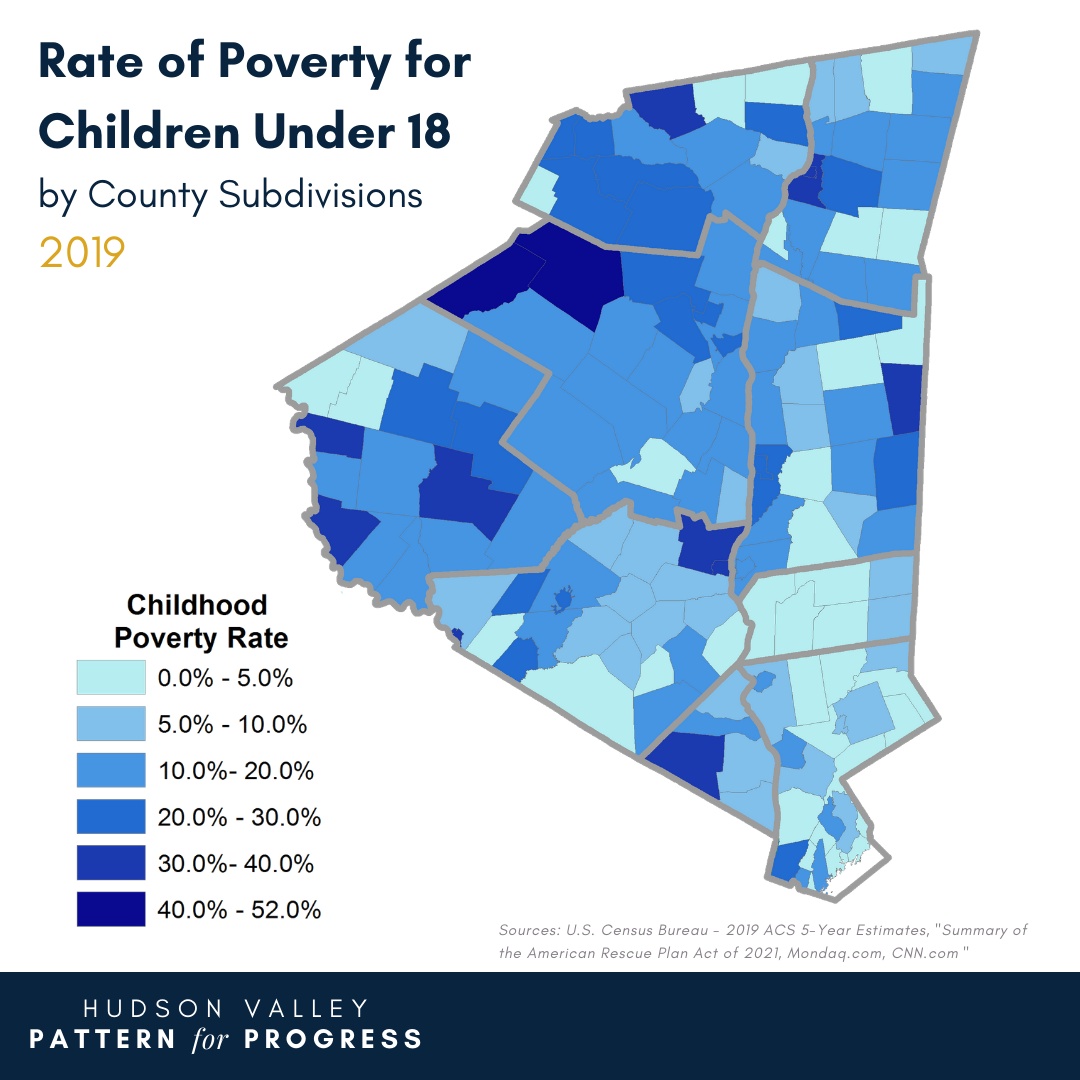
Rate of Poverty for Children Under 18
April 6th, 2021 Poverty rates for children under 18 years are as high as 40.0% or more in parts of the Hudson Valley. With the new $1.9 trillion stimulus bill, the 2021 child [...]
March 2021

Average Commute to Work
March 30th, 2021 This map shows the average commute to work in 2019 for workers aged 16 or older. The map show a concentration of relatively high average commute times in lower Dutchess [...]